 Last time we looked at regulatory compliance standards and benchmarks, vSphere tag creation and application and finally for the majority of the post at configuring vRealize Operations to continually monitor for system hardening standard / benchmark compliance.
If you have not yet seen that post, catch up now. It’s a great read. ![]()
As mentioned, this post is part 2 of a multipart series. Find the other parts here:
- Part 1: Creating Continual Regulatory Compliance
- Part 2: This part: Monitoring and Reporting Regulatory Compliance
Overview
Monitoring Compliance
We need a dashboard. Let’s create one! Luckily for us vRealize Operations (vRO) has just the thing.
From the vRO console, select Visualise > Dashboards and let’s search for compliance:
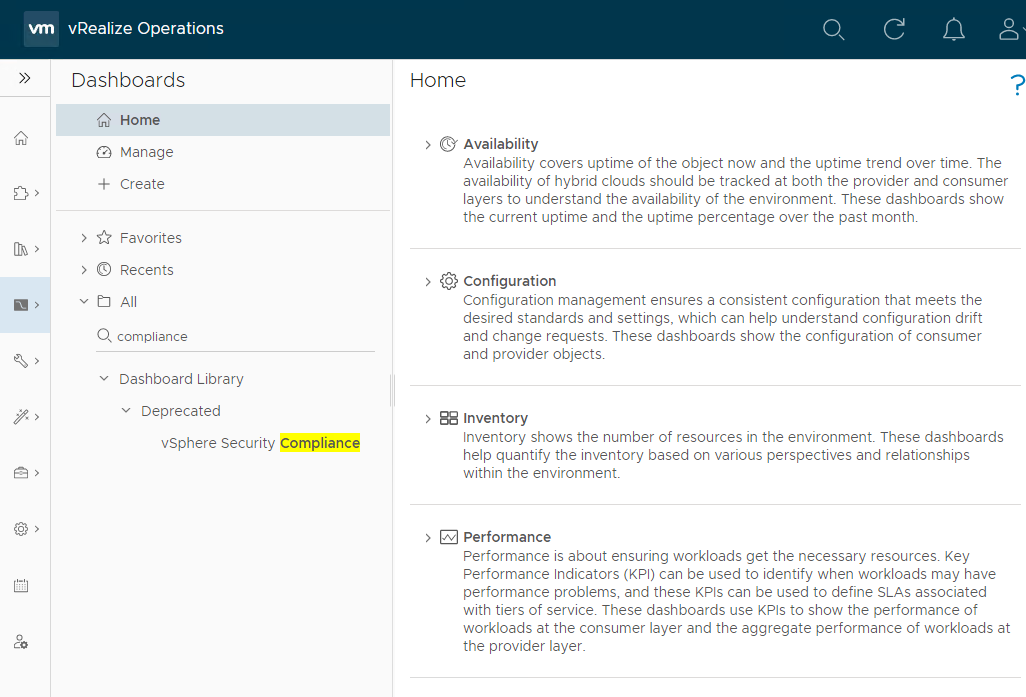
Not sure why the built in compliance dashboard is deprecated, but hey lets use it as a base for a new custom dashboard anyway. Taking a look at the dashboard:
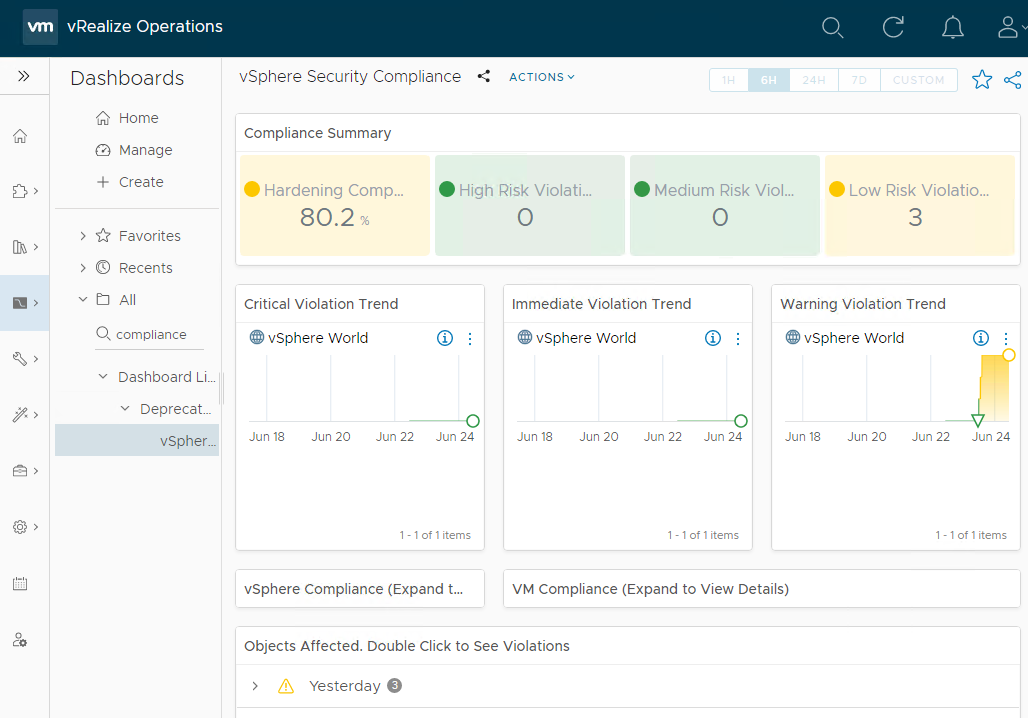
Nice. Let’s clone the dashboard to create our own. Click Manage and filter on compliance to find the dashboard in the dashboard library:
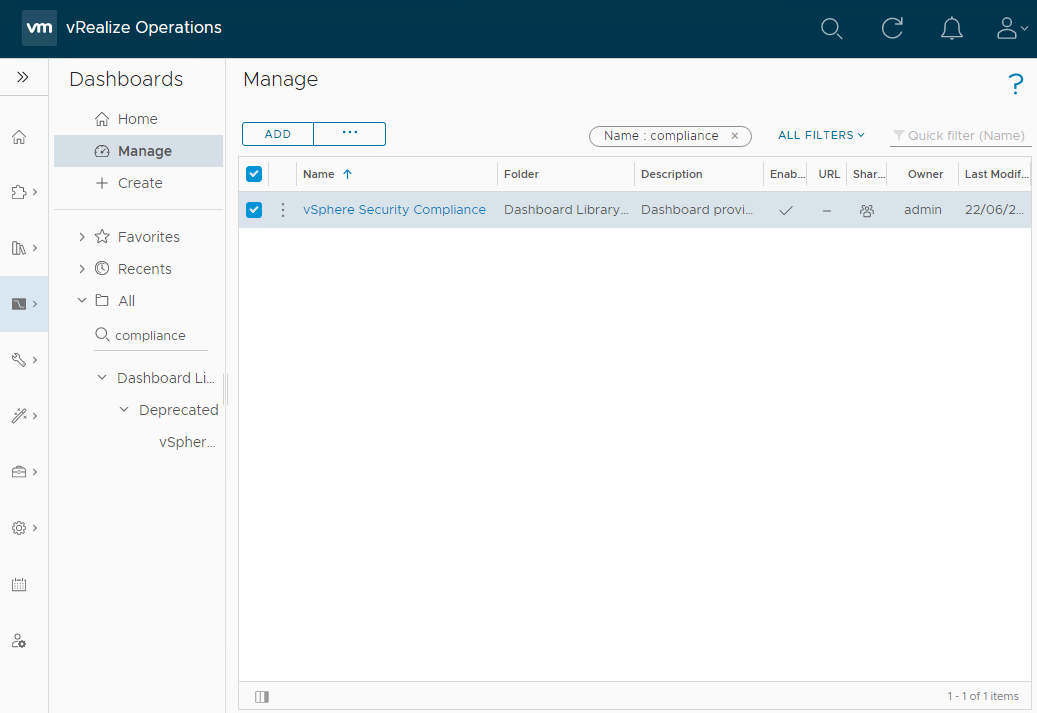
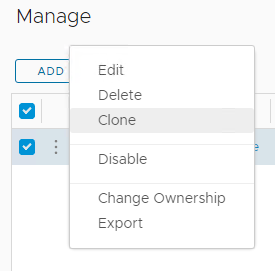
Use the three vertical dots to clone the dashboard:
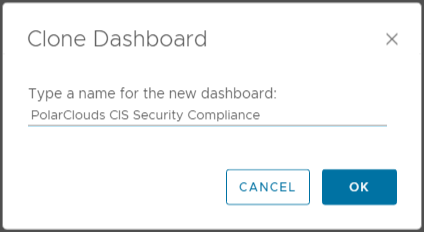
I’ll name my new dashboard PolarClouds CIS Security Compliance:
Again, using the three vertical dots, let’s edit the PolarClouds CIS Security Compliance dashboard. I’m not going to go into super detail here as dashboards are a can be subject to personal taste, but here are the changes I’ve made (you are of course free to make your own!):
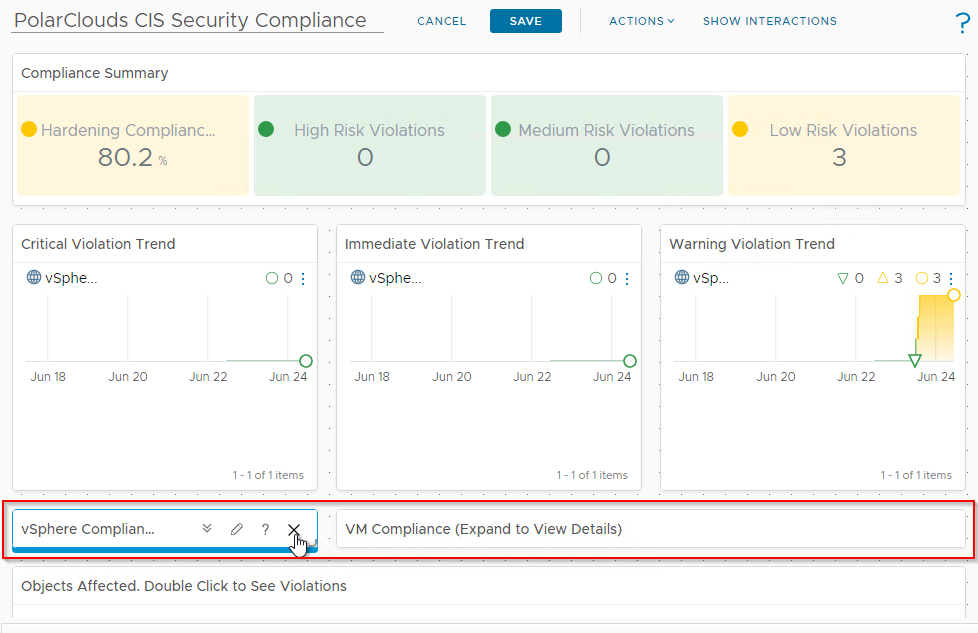
- Removed the vSphere and VM Compliance heat maps:
- Group the affected objects by “None”:
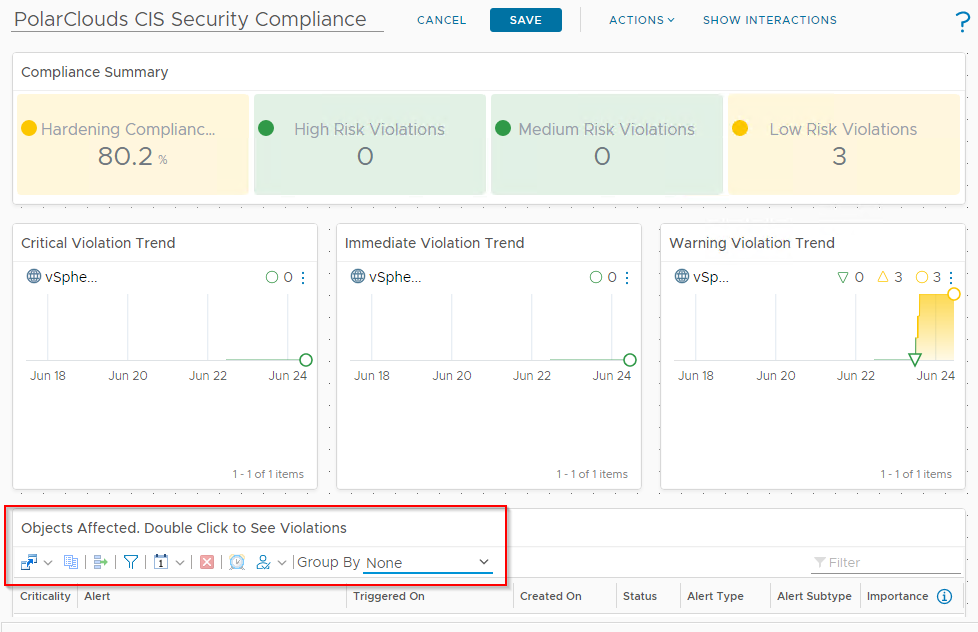
As this is a small environment with eventually zero compliance issues, I’m happy to put the hopefully empty list on non-compliances right on my dashboard! I’ll rename the widget “Non-Compliant Objects” too.
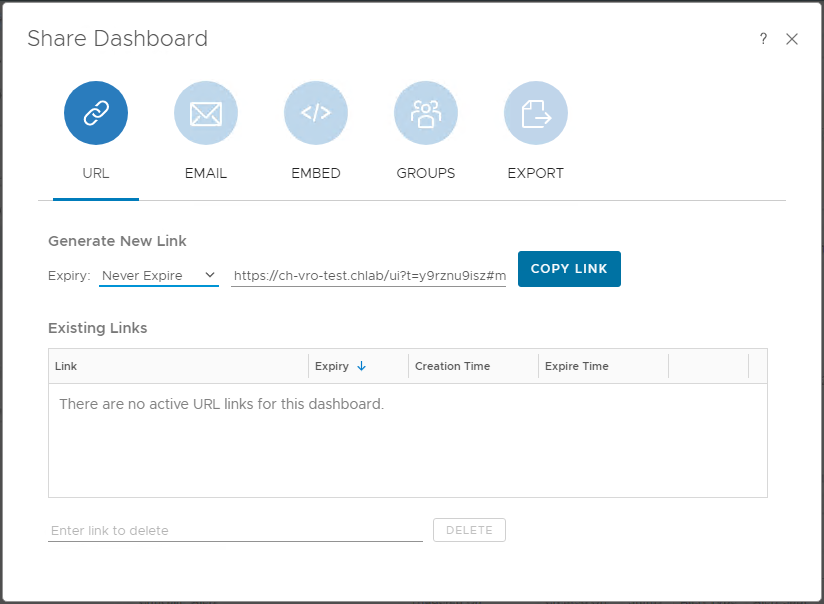
That’s it. I’ll save the dashboard and using the share button, setting the expiry to Never Expire, I’ll grab the link to my nice new dashboard:
Lets take a look at the final dashboard:
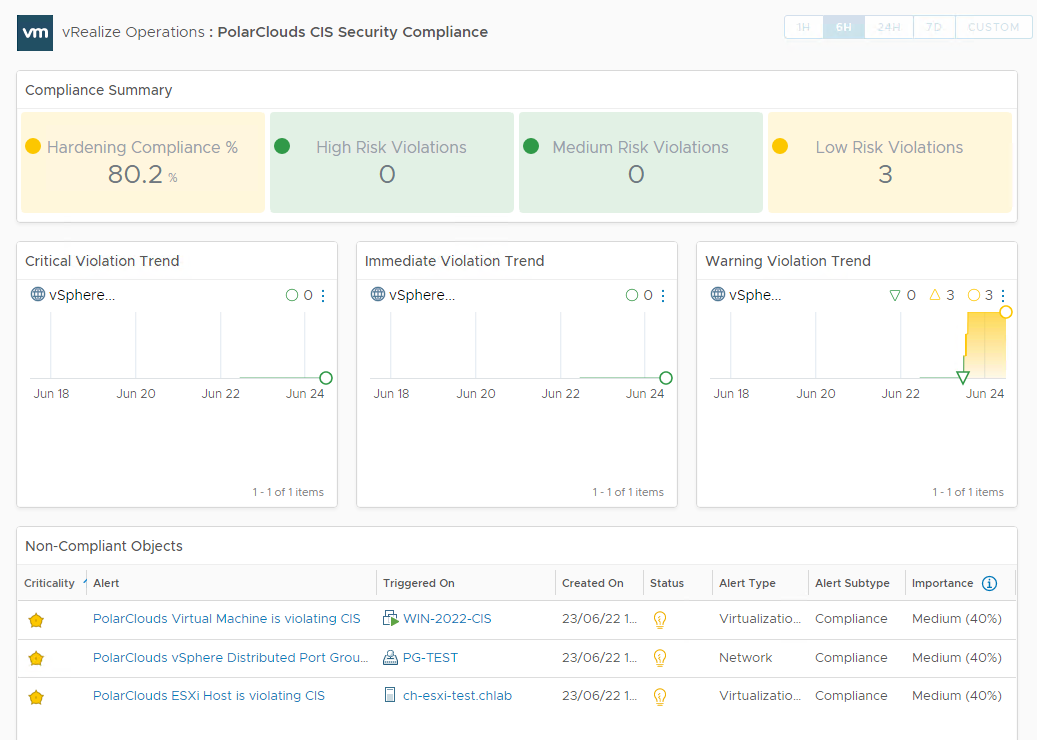
Happy with that. Yes, there is some hardening of the environment yet to do, I’ll forward the link to the security and compliance departments.
Reporting Compliance
Next, let’s work on reporting. Reports are consist of one or more views, so we’ll work on creating our views first.
For my report I’m going to include the following views:
- CIS Compliant Virtual Machines
- CIS Compliant ESXi Hosts
- CIS Compliant Virtual Switches
- CIS Compliant Virtual Switch Port Groups
- CIS Non-Compliant Virtual Machines
- CIS Non-Compliant ESXi Hosts
- CIS Non-Compliant Virtual Switches
- CIS Non-Compliant Virtual Switch Port Groups
- CIS Excluded Virtual Machines
- CIS Excluded ESXi Hosts
- CIS Excluded Virtual Switches
- CIS Excluded Virtual Switch Port Groups
Sure twelve views is a lot (remember CIS does not harden vCenter), but through the power of cloning and tweaking the filters we really only have to create four views.
Views
Virtual Machines
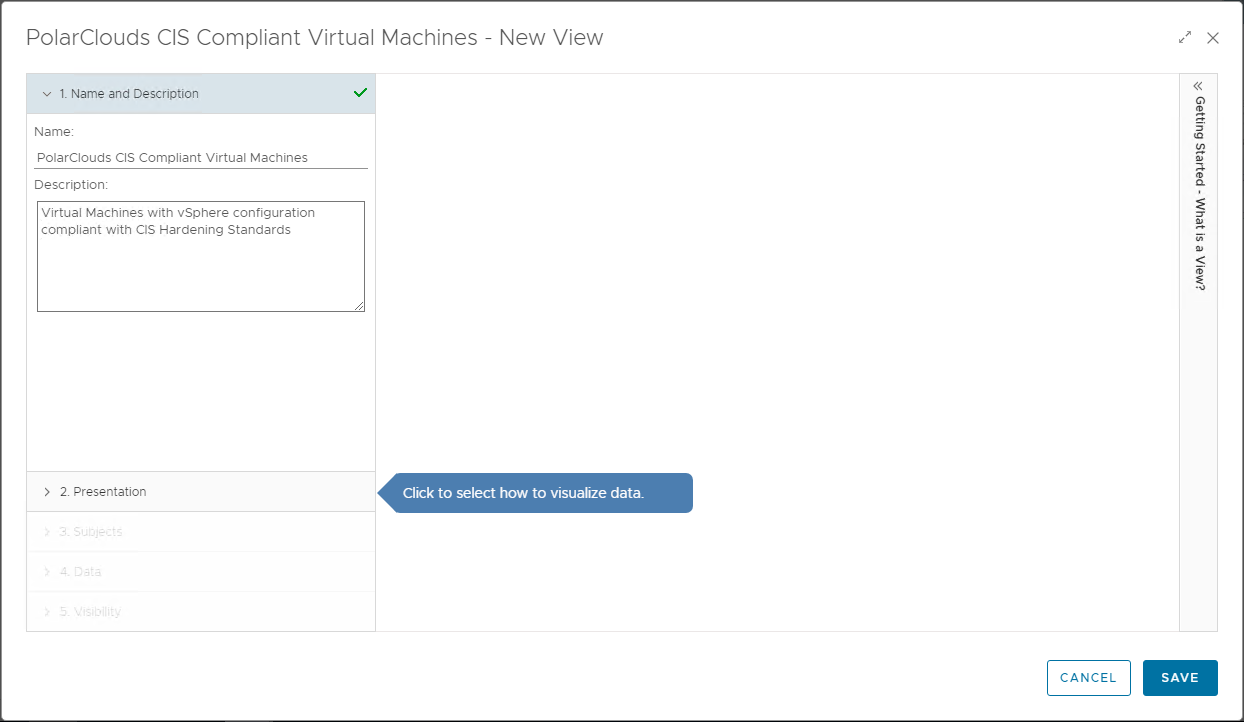
From the vRO console, select Visualise > Views > Manage > Add and let’s create a view to add to a report. I’ll call my view “PolarClouds CIS Compliant Virtual Machines” and set the description as “Virtual Machines with vSphere configuration compliant with CIS Hardening Standards”:

Selecting step 2, lets create some views.
Click + to add a view. We will name this first view PolarClouds CIS Compliant Virtual Machines and set the description ro Virtual Machines with vSphere configuration compliant with CIS Hardening Standards:
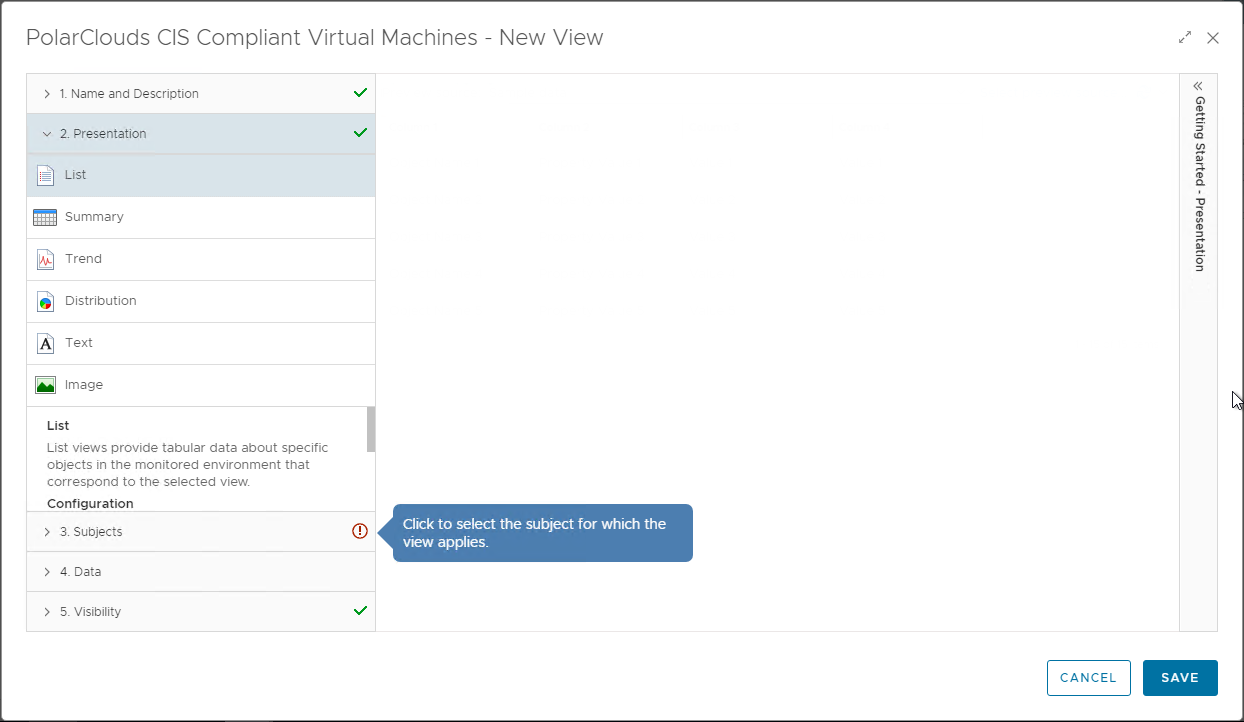
Next, lets present some data in list form, so select List:
Moving onto step 3, lets set our subjects as vCenter Adaptor > Virtual Machine
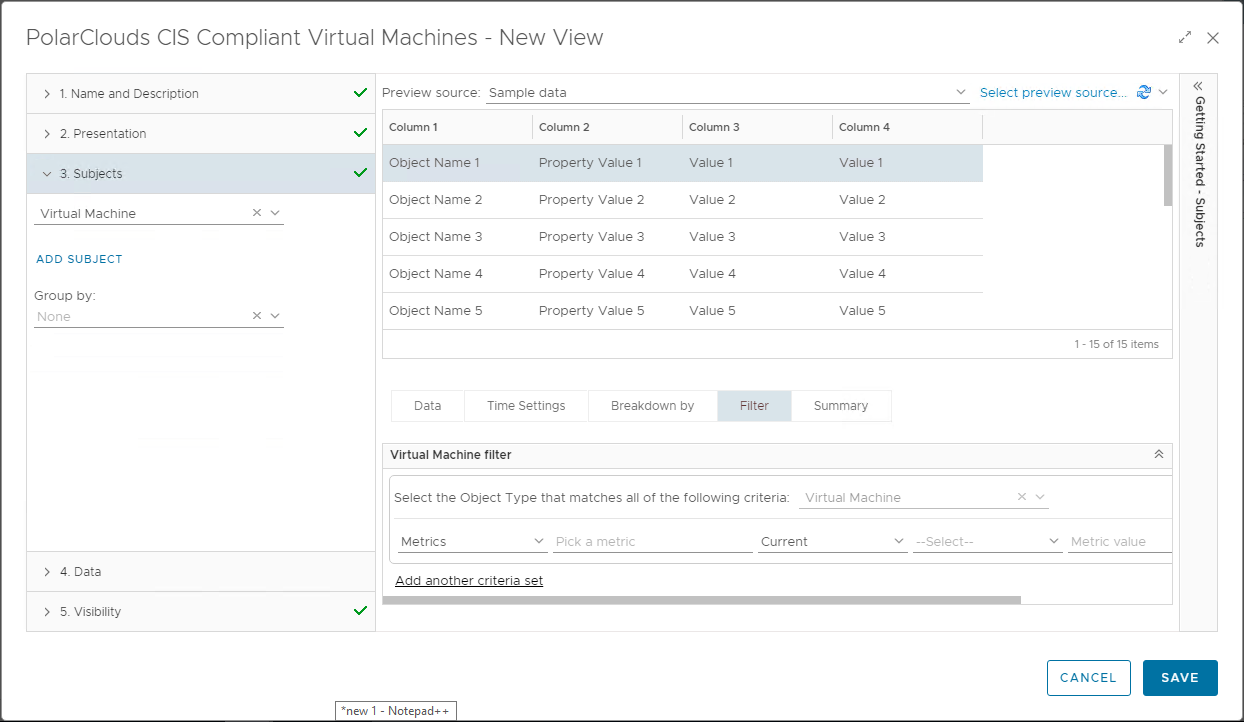
Moving onto step 4, lets find some data to populate our list with. When we find our property / metric, simply drag to add to the list:
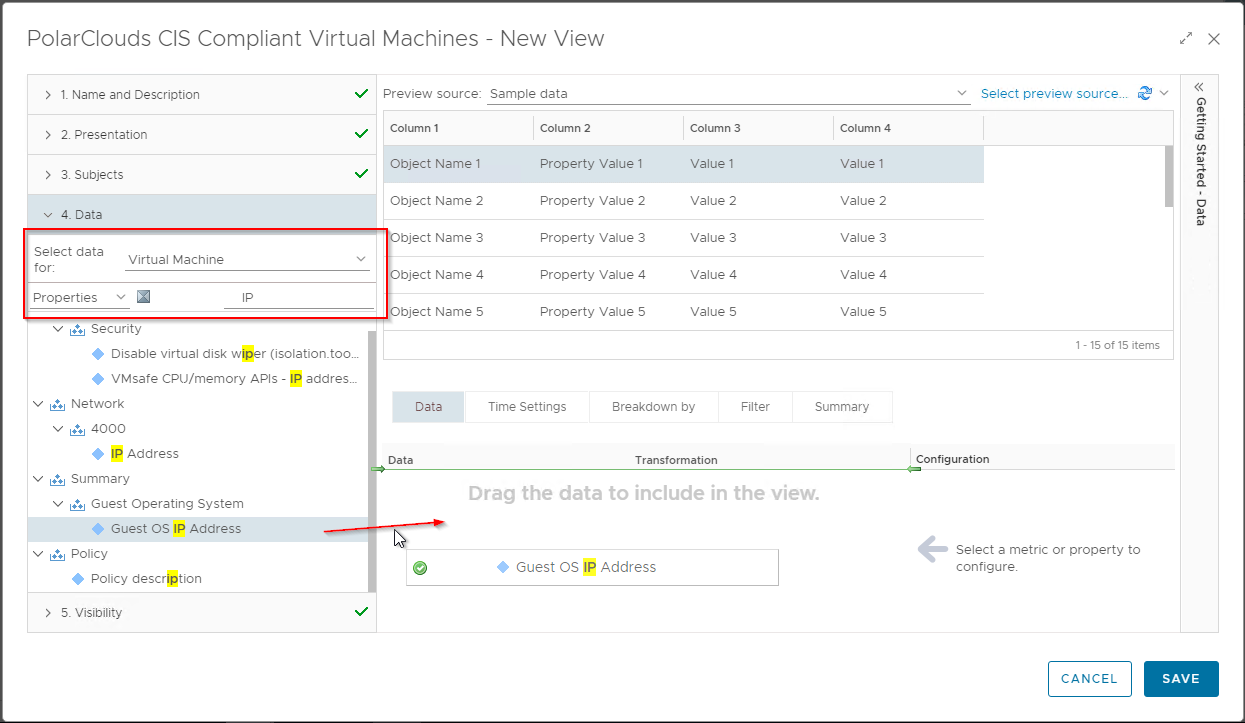
Label the Metric and add a sort order:

The full list of VM properties and metrics I use is, along with their paths is:
- VM IP Address : Properties > Summary > Guest Operating System>Guest OS IP Address
- VM Operating System : Properties > Summary > Guest Operating System > Guest OS from Tools
- VM CIS Compliance : Metrics > Badge > Compliance (%)
Next, lets filter to show only the VMs that are 100% compliant:

The final configuration of the view:
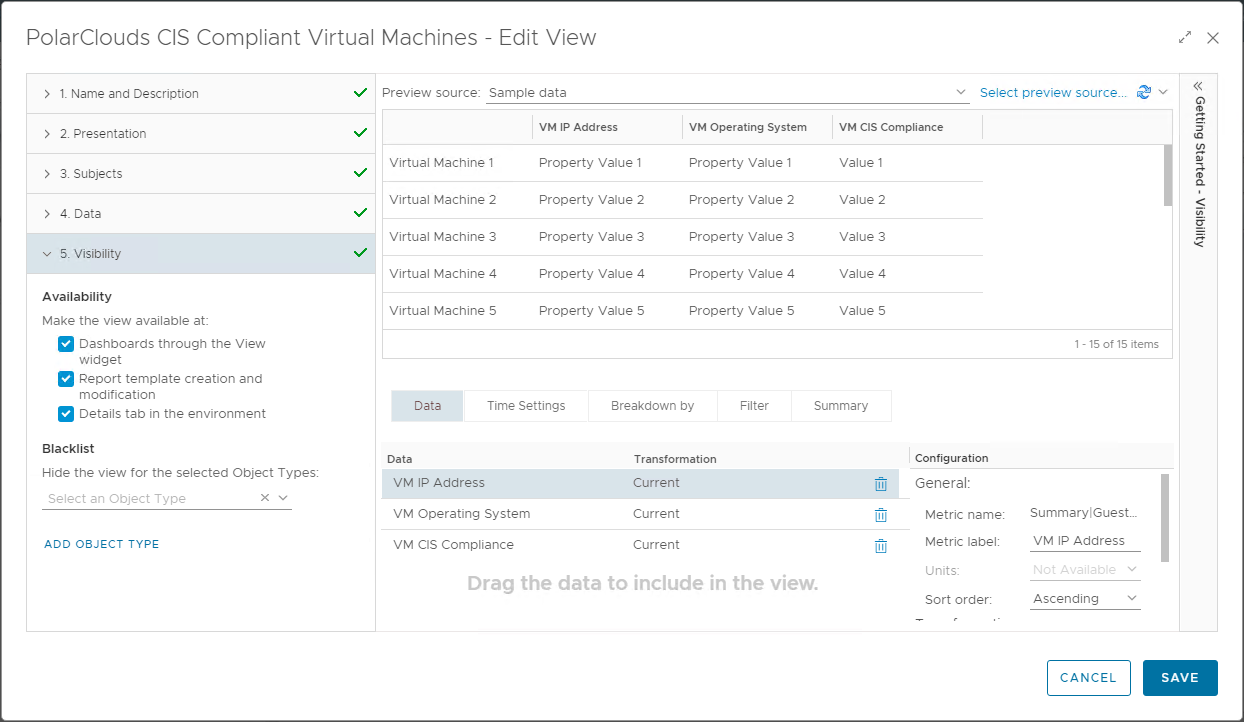
Finally click Save to save the view.
Next we’ll create the CIS Non-Compliant Virtual Machines view.
Clone the previously created view:
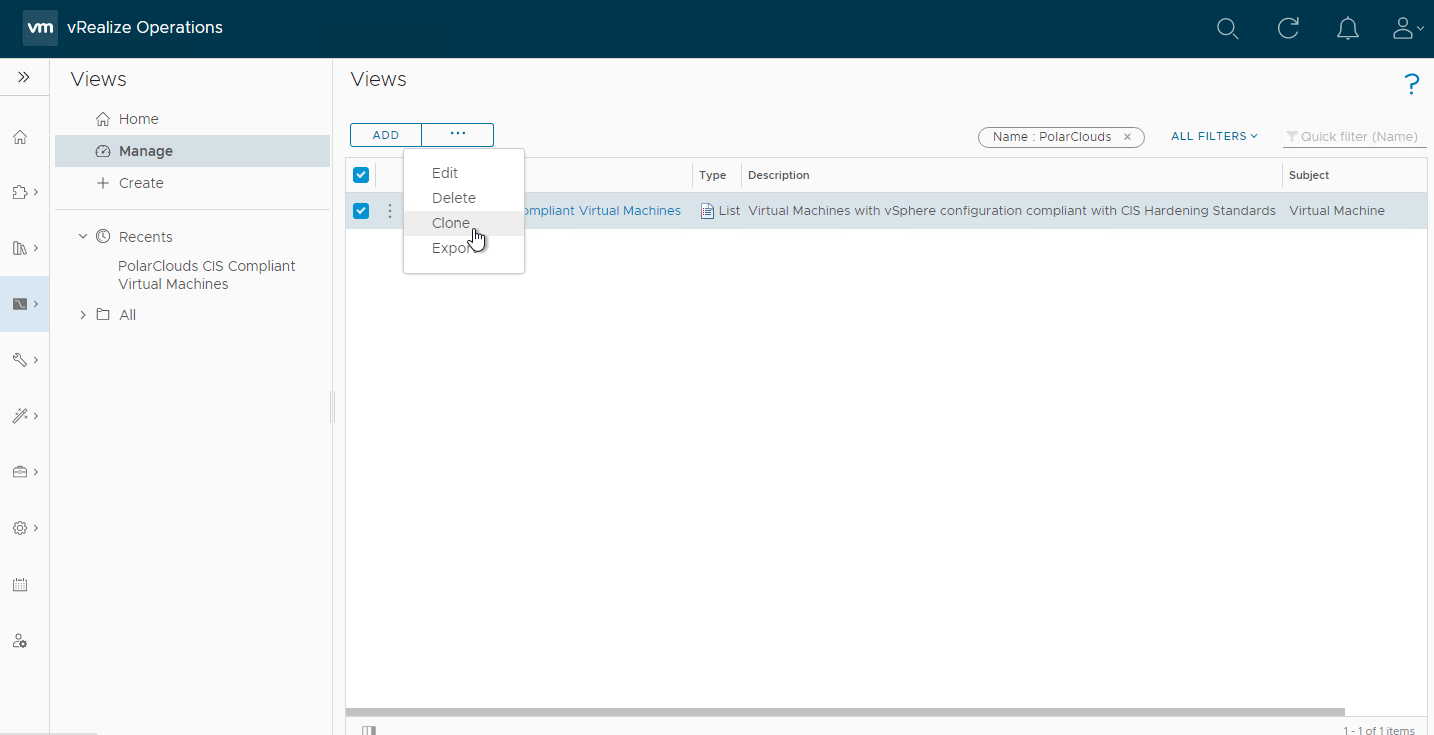
Update Name and description:
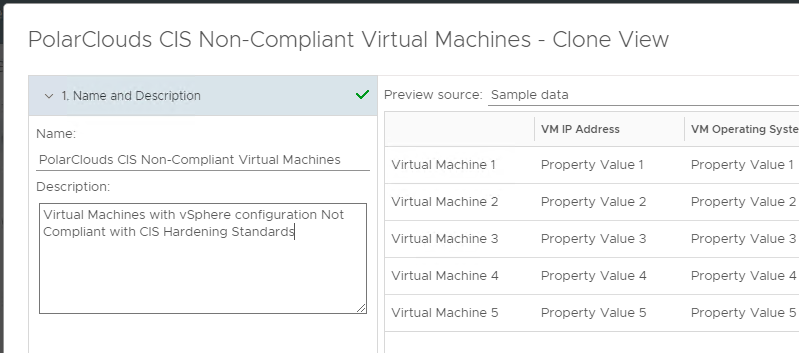
Select 4. Data
Change compliance operator to is not
Add Properties > vSphere Tag > Current > is not > [< Compliance-CIS-Excluded >]:
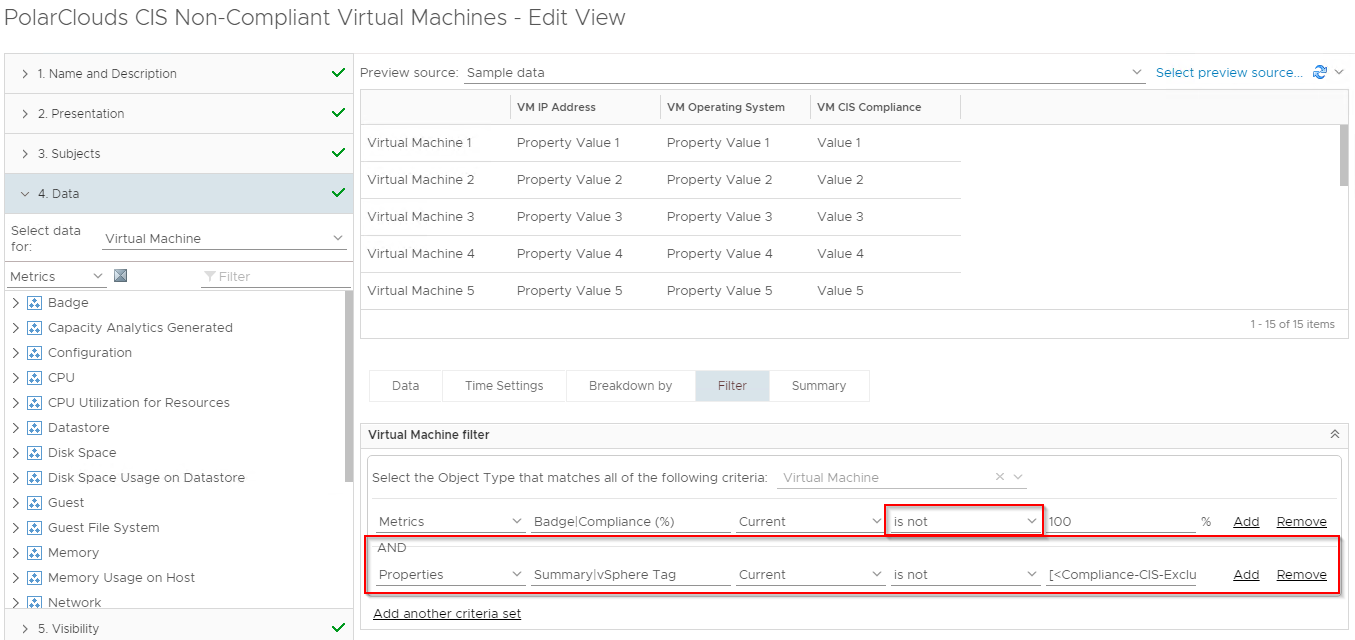
Finally save the view.
Given that we know that we have some non-compliant VMs, we can preview the view. Select the Non-Compliant view from the Recents list, click Select preview source and select vCenter Adapter > vSphere World . vSphere World. Looking good:
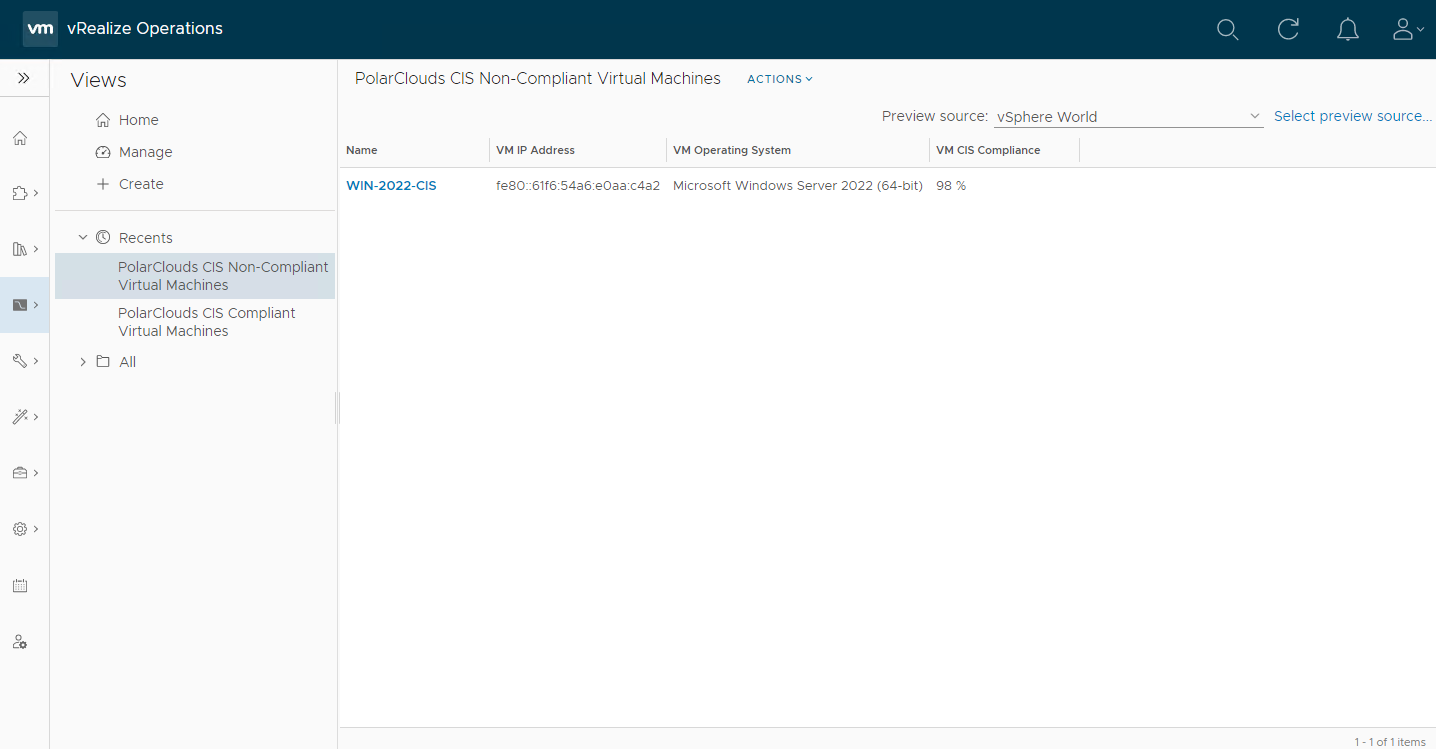
Just our VM with a serial port!
Finally lets clone and tweak the filter again to create our CIS Excluded Virtual Machines view. I’ve also removed the VM CIS Compliance column from the view.
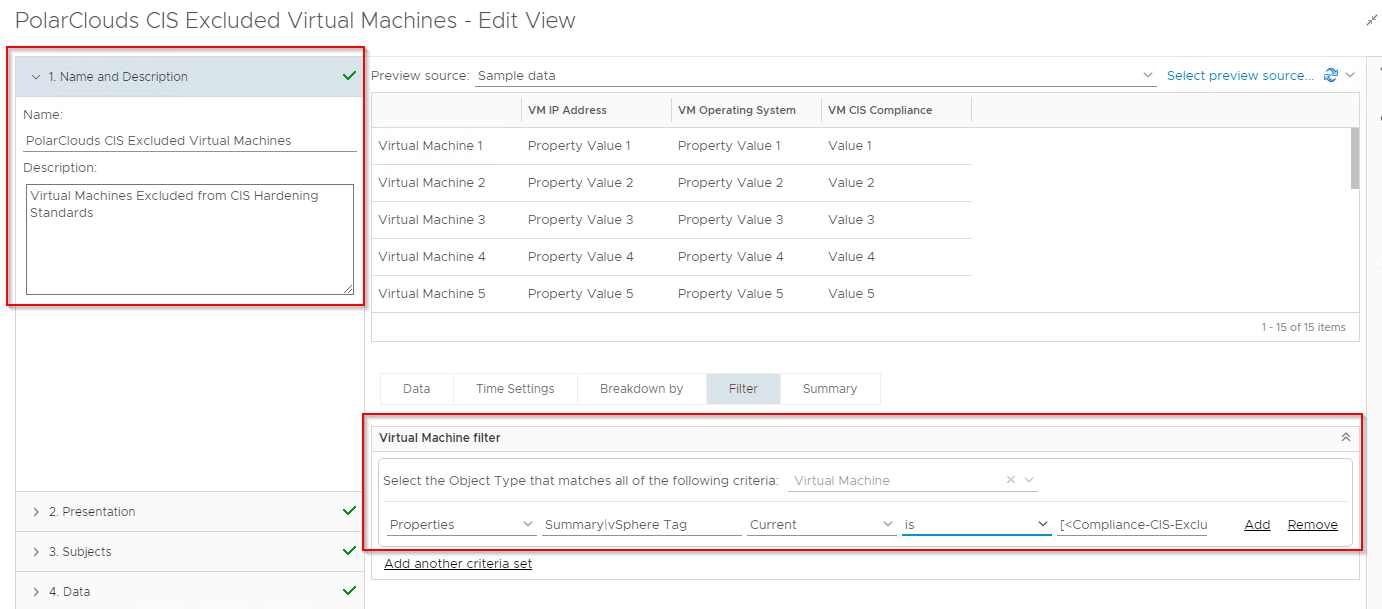
Using vSphere World as a preview source:

Yep our two excluded VMs are listed. Hey presto we have our three VM views:

ESXi Hosts
From the vRO console, select Visualise > Views > Manage > Add and let’s create a view to add to a report. I’ll call my view “PolarClouds CIS Compliant ESXi Hosts” and set the description as “ESXi Hosts with vSphere configuration compliant with CIS Hardening Standards”.
Again I shall configure presentation in list form and I’ll include the following properties and metrics:
- Host IP Address : Properties > Network > Management Address
- Host Operating System : Properties > System > Product String
- Host Version - Build Number: Properties > Summary > Version
- Host CIS Compliance : Metrics > Badge > Compliance (%)
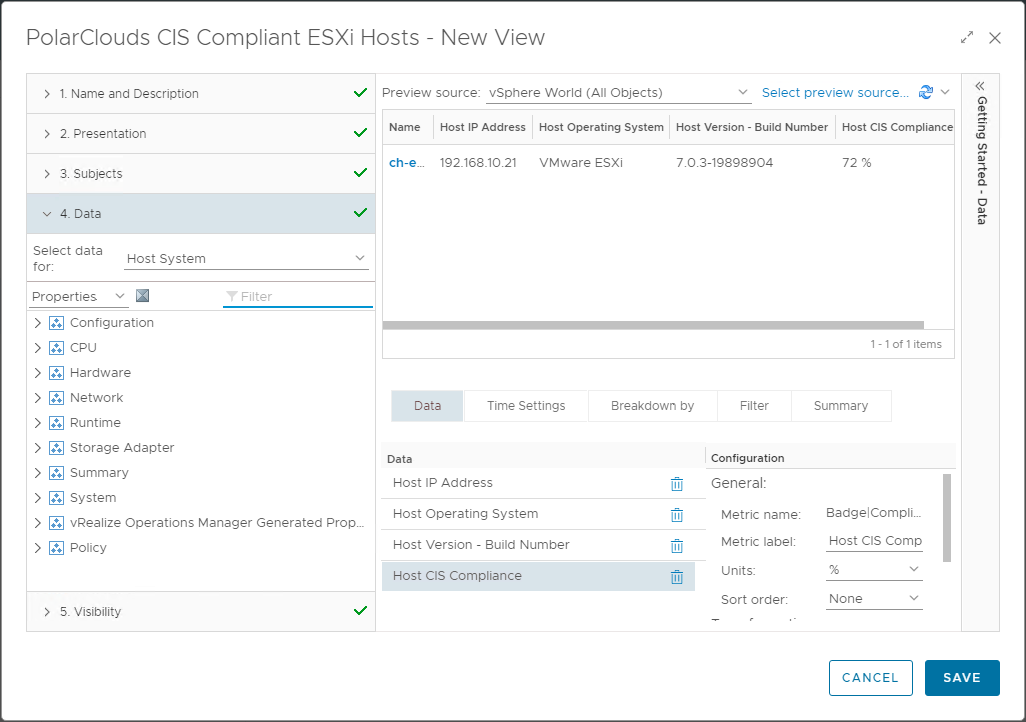
Again we’ll clone and set our filters accordingly to create the three views:
- CIS Compliant ESXi Hosts
- Filter : Metrics > Badge > Compliance (%) > Current > is > 100
- CIS Non-Compliant ESXi Hosts
- Filter : Metrics > Badge > Compliance (%) > Current > is not > 100
- And : Properties > Summary > vSphere Tag > Current > is not > [< Compliance-CIS-Excluded >]
- CIS Excluded ESXi Hosts
- Filter : Properties > Summary > vSphere Tag > Current > is > [< Compliance-CIS-Excluded >]
Virtual Switches
Again three new views with the following properties and metrics:
- Switch Version - Build Number : Properties > Summary > Version
- Switch CIS Compliance : Metrics > Badge > Compliance (%)
Clone and set our filters accordingly to create the three views:
- CIS Compliant Virtual Switches
- Filter : Metrics > Badge > Compliance (%) > Current > is > 100
- CIS Non-Compliant Virtual Switches
- Filter : Metrics > Badge > Compliance (%) > Current > is not > 100
- And : Properties > Summary > vSphere Tag > Current > is not > [< Compliance-CIS-Excluded >]
- CIS Excluded ESXi Hosts
- Filter : Properties > Summary > vSphere Tag > Current > is > [< Compliance-CIS-Excluded >]
Virtual Switch Port Groups
Finally three more views with the following properties and metrics:
- Port Group VLAN ID : Properties > Configuration > Policies > Security > VLAN ID
- Port Group VLAN Trunk : Properties > Configuration > Policies > Security > VLAN trunk range
- Port Group CIS Compliance : Metrics > Badge > Compliance (%)
Clone and set our filters accordingly to create the three views:
- CIS Compliant Virtual Switch Port Groups
- Filter : Metrics > Badge > Compliance (%) > Current > is > 100
- CIS Non-Compliant Virtual Switch Port Groups
- Filter : Metrics > Badge > Compliance (%) > Current > is not > 100
- And : Properties > Summary > vSphere Tag > Current > is not > [< Compliance-CIS-Excluded >]
- CIS Excluded Virtual Switch Port Groups
- Filter : Properties > Summary > vSphere Tag > Current > is > [< Compliance-CIS-Excluded >]
Phew! Done!
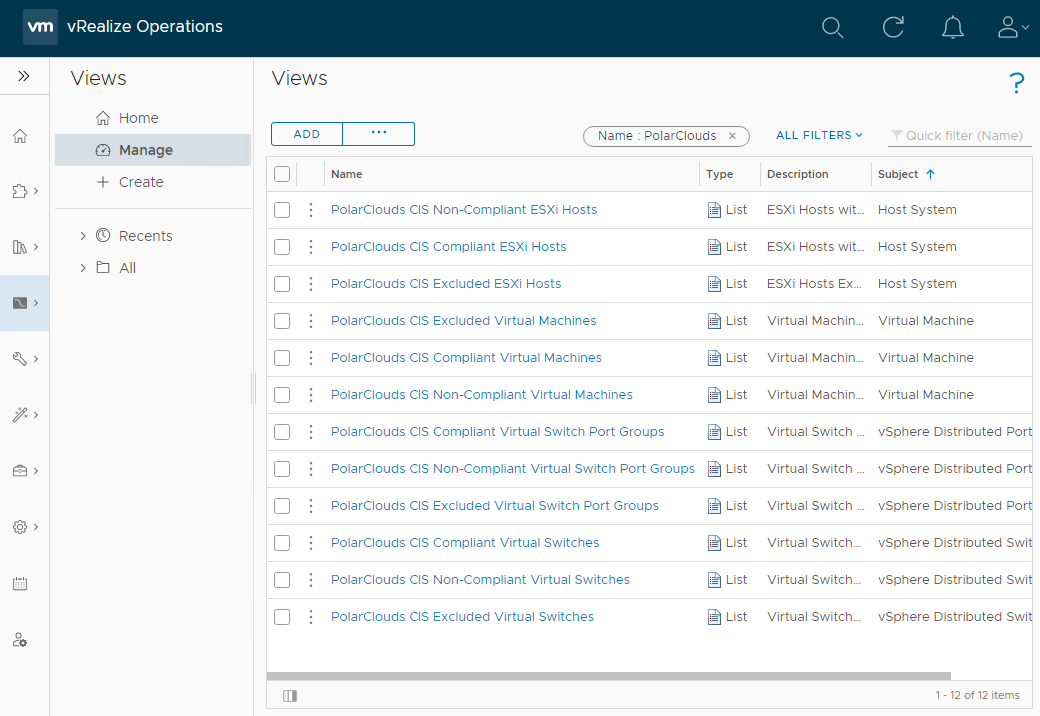
Reports
Now that we have sliced and diced out data into views, lets bundle the results into a report for review and action.
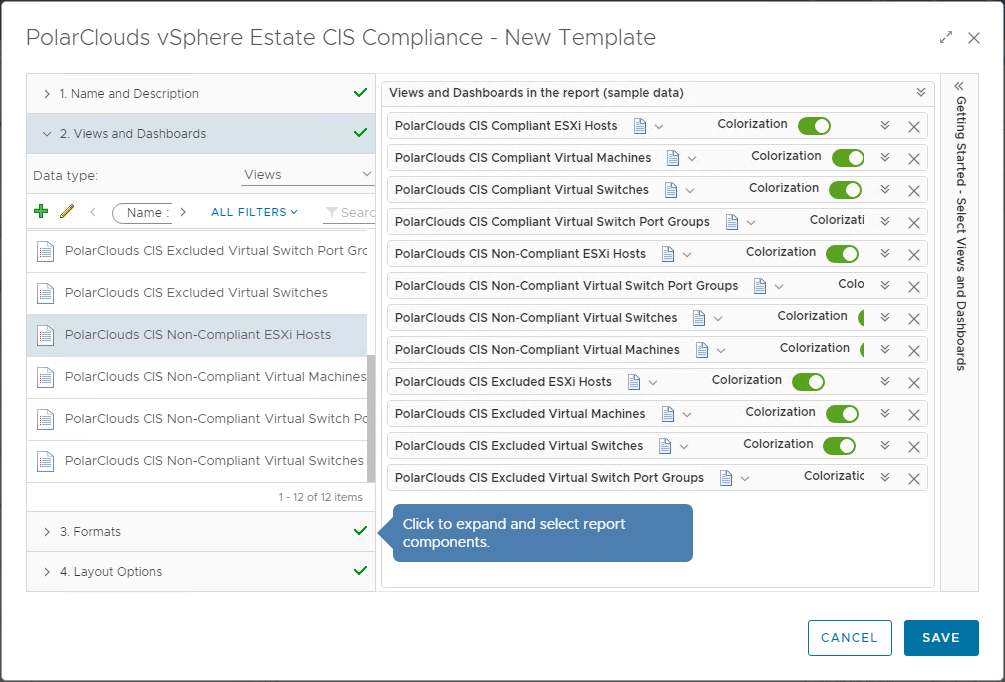
From the vRO console, select Visualise > Reports > Manage > Add and let’s create a report. I’ll call my report “PolarClouds vSphere Estate CIS Compliance” and set the description as “Status of vSphere CIS Compliance across the PolarClouds vSphere Estate”
Next, add the twelve views previously created:
Finally, I’ll enable PDF and CSV formats, add a cover page, table of contents and a footer.
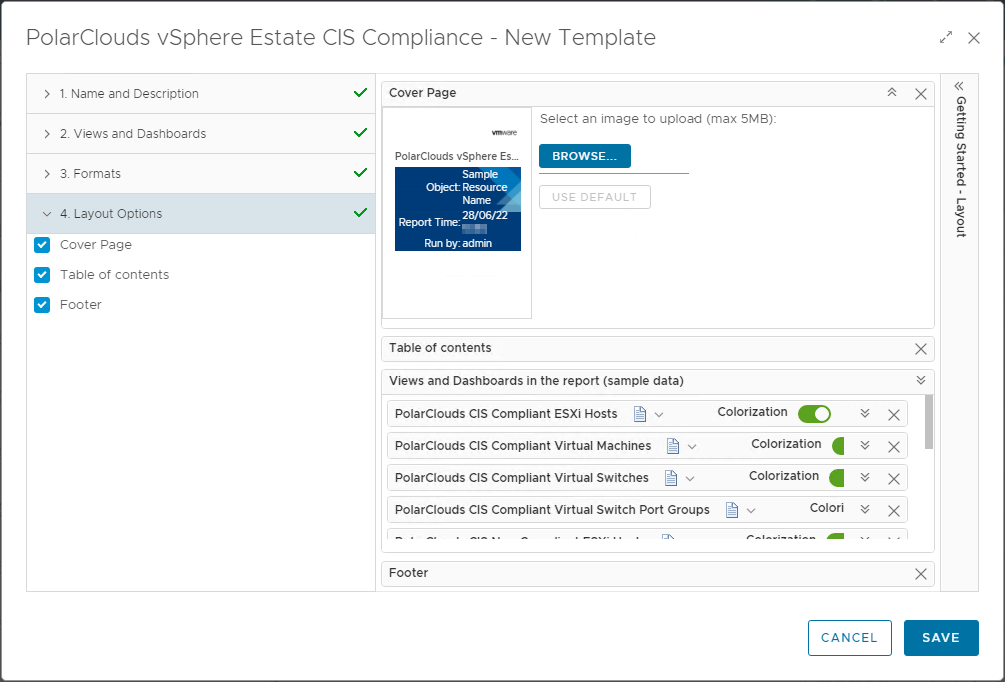
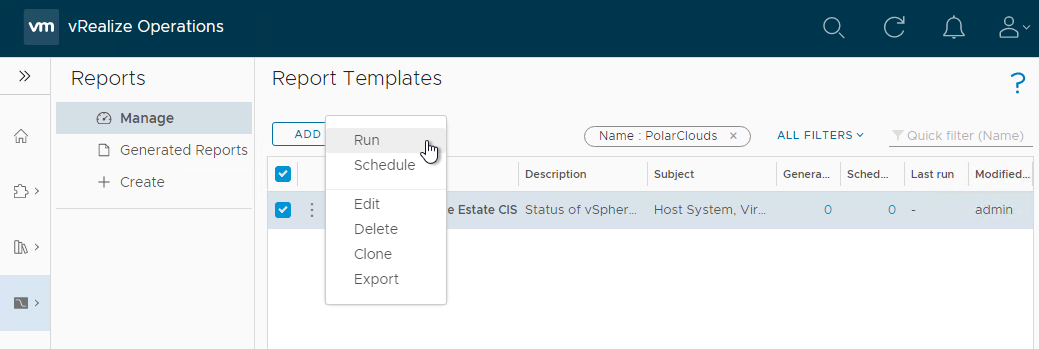
Save, find in the list and run the report against vSphere World:
And here is the report:
Grab your copy of the report: PDF CSV
As you can see, I added a slightly tweaked version of the dashboard to the report too, thus making a nice summary page ![]()
Conclusion and Wrap Up
So there we have it.
In this post we looked at creating dashboards, views and reports to publicise our example PolarClouds lab environment CIS compliance and and non-compliances further.
All that is left is to harden the environment keeping an eye on our dashboard and reports as we go.
As you will have seen over the course of this series, vRealize Operations is able to assist with meeting and reporting security compliance across the vSphere estate and ensuring that compliance remains in place via dashboards and reports.
Chris’ Final Thought 1
Trust, but verify. Compliance standards can and will change.
Therefore don’t take VMware’s vRO compliance as the final word for a compliant environment. Third party compliance scanning solutions such as those available from Tenable and Qualys exist for a reason.
Chris’ Final Thought 2
Usual disclaimer applies.
And that’s it!
As mentioned, this post is part 2 of a multipart series. Find the other parts here:
- Part 1: Creating Continual Regulatory Compliance
- Part 2: This part: Monitoring and Reporting Regulatory Compliance
As I said at the end of part 1:
Sure compliance is a dry and often a difficult subject to crack, however hopefully with the use of a automated and continuous monitoring tool such as vRealize Operations, we can ensure that our vSphere environment is always meeting its required compliance standard, whatever standard that may be.
-Chris

