


 Pic: Clefty |  Pic: Steve Hoang |  Pic: Ged Carroll |
Absolutely anywhere!!!
So what can be done to get to the bottom of these BSOD's, how can Windows be fixed so as not to suffer another BSOD in the future? Simple. Use debugging tools for Windows. Here is how.
Capturing a Memory Dump File
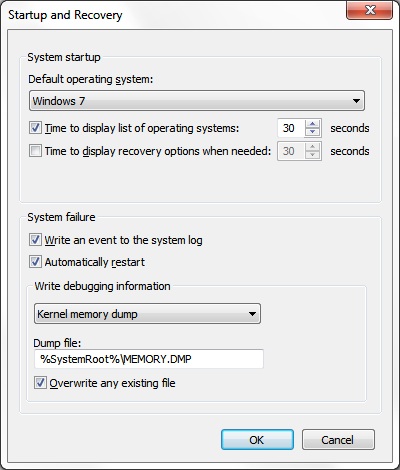
First off, you are going to need to capture a memory dump file from the BSOD. A complete memory dump records all the contents of system memory when the system stops unexpectedly. A complete memory dump may contain data from processes that were running when the memory dump was collected. Here is how to configure Windows to dump it's memory to disk:- Windows 2000/2003/XP: Right-click the My Computer icon, click Properties and then click the Advanced tab. In the Startup and Recovery section, click the Settings... button.
- Windows Vista/Windows 7/Windows 8: Right-click the Computer icon, click Properties and then click the Advanced system settings link on the left pane. Click the Advanced tab and in the Startup and Recovery section, click the Settings... button.
- Small memory dump – 64 KB in size, records the most important information about the problem
- Kernel memory dump – A complete record of system memory; creates files at the size of the operating memory
All you need to do now is wait for your system to crash again!
OK, so you've created your MEMORY.DMP dump file. Now we need to examine it using the Microsoft Debugging Tools for Windows.
Installing Debugging Tools for Windows
First off, you do not need to install the debugging tools on the system that is having the BSOD problem. Use another system if possible. The system will need to have around 200Mb free disk space and be able to access the internet.Microsoft, in their wisdom, have decided to bundle the debugging tools in with their Windows Software Development Kits (SDK). But have no fear, we don't have to download the whole SDK!
But before we can get to the SDK, we first have to install MS .NET Framework 4.5. Grab the Web installer or Offline installer from here (Microsoft)
Once you have .NET 4.5 installed, you can go ahead and grab the Windows 8 SDK installer from here (Microsoft)
Launch the SDK installer, and choose "Install to this computer":

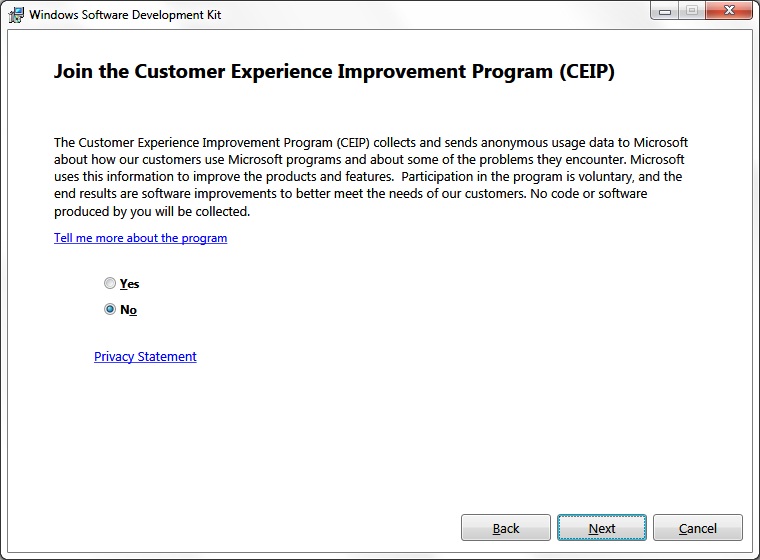
Choose whether to join CEIP:
Accept the license agreement. Now select ONLY "Debugging Tools for Windows" and click Install:

Once installation is complete, click Close to finish.
Using the Windows Debugging Tools
Windows Debugging tools will buried away in your start menu under "Windows Kits":
Don't worry if you only have X86 version installed. This version will debug 64bit crash dumps without issue. The program you are looking to run is WinDbg(x64) or WinDbg(x86)
Next you need to set the debugging symbol file path:

Whats a debugging symbol? Here you go (Wikipedia). We need to set the debugger to use Microsoft's very own symbols server and cache them locally in C:\Symbols. This is entered as follows:
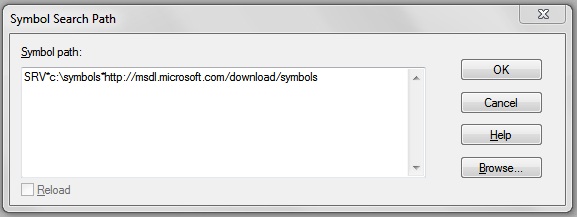
SRV*c:\Symbols*http://msdl.microsoft.com/download/symbols
That is it for this part folks.
You have your MEMORY.DMP dump file and you have setup your Windows debugging environment. Carry on to part 2: Debugging available here
- Chris