 Recently I had an engagement to take a look at an underperforming vSphere estate owned by a client. The engagement had been escalated my way as - by their own admission - the client were not at all familiar with complex vSphere diagnosis and they needed some consulting to get them back on track.
Statements like “the environment is running slow”, “it doesn’t perform as it used to”, “nothing has changed” and “this is causing major business impact” are insightful and understandable but they don’t help to get to the root cause.
Given the nature of the client business, all their vSphere environments had to stay on premises (actually 90+ sites, but that’s another story) which meant a move to cloud was out of the question.
Also, given ongoing supply chain issues, the client was not in a position to procure new hardware either; certainly nowhere within the time-frame required.
So to sum up:
- Diagnose
- Fix - and fix quickly
- No new infrastructure
- No cloud
Which got me thinking.
- What tools exist that can give a “10,000 feet” overview of an environment?
- How can I “zero in” on the root cause of an issue?
- I’m sure whatever the issue (or issues), the answers are somewhere in the system logs
Hmmm. There must be something…
Enter VMware Skyline Health Diagnostics (SHD)
Overview
From the introductory post on the VMware vSphere blog:
Skyline Health Diagnostics for vSphere is a self-service tool to detect issues using log bundles and suggest the KB remediate the issue. vSphere administrators can use this tool for troubleshooting issues before contacting VMware Support.
What’s more, the tool is available free of cost and can optionally be used completely offline. That’s right, no internet required! Take a look at SHD FAQ for full details.
SHD can integrate directly into your vSphere environment or it can remain separate and be used for analysis of log files or “log bundles” as VMware calls them.
My preferred way of working is to keep SHD as separate from the environment under analysis as possible. I don’t want to skew my findings by deploying yet more VMs on an environment that is already suffering.
Therefore, I’ll deploy SHD as a VM on my laptop and use it to analyse log bundles. This also helps with “mobile analysis” - I can fire up the SHD VM on my laptop at anytime and I’m ready!
Deployment
Grab the latest OVA from https://customerconnect.vmware.com/downloads/get-download?downloadGroup=SKYLINE_HD_VSPHERE
Given that Skyline Health Diagnostics (SHD) is delivered from VMware in the form of an OVA, means that the appliance can be deployed anywhere; into an existing vSphere environment (preferably NOT the environment you are diagnosing) or into VMware Workstation.
As I was going mobile, chose to deploy to VMware Workstation.
Workstation Wrinkle
I spotted a minor wrinkle when deploying SHD appliance v3.5.0-20430938 into VMware workstation 16.2.4:
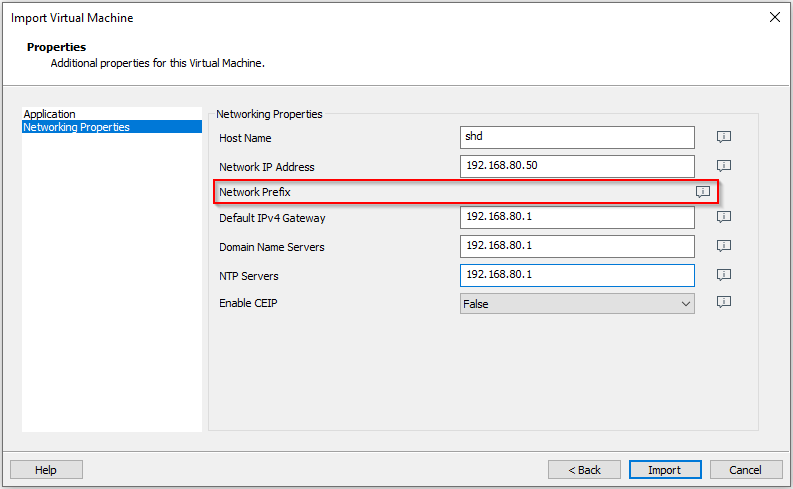
Yep, the Network Prefix box is missing. Weird.
OK, lets fix post deployment (assuming I can type the same password I literally set two minutes ago ![]() ):
):
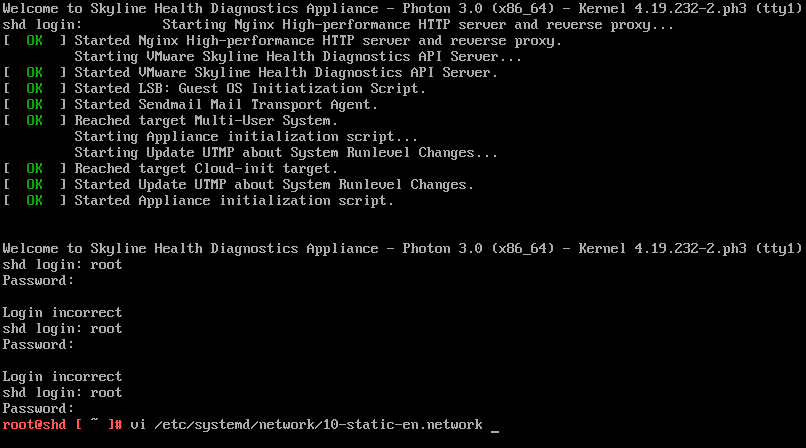
Edit the network config:
vi /etc/systemd/network/10-static-en.networkSet the correct IP prefix:
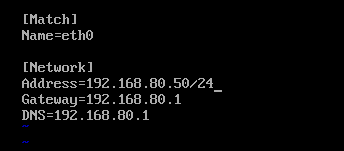
Save and reboot:
reboot nowConfiguration
Could not be any easier. Accept the EULA and choose whether to join the VMware Customer Experience Improvement Program (CEIP).
As I say, I want to be 100% offline here so I opted out of joining the CEIP.
Configuration complete!
Grab a vCenter or ESXi Log Bundle
Whilst SHD can analyse vCenter and ESXi host log bundles, I’ll concentrate in this post on analysing an ESXi host log bundle.
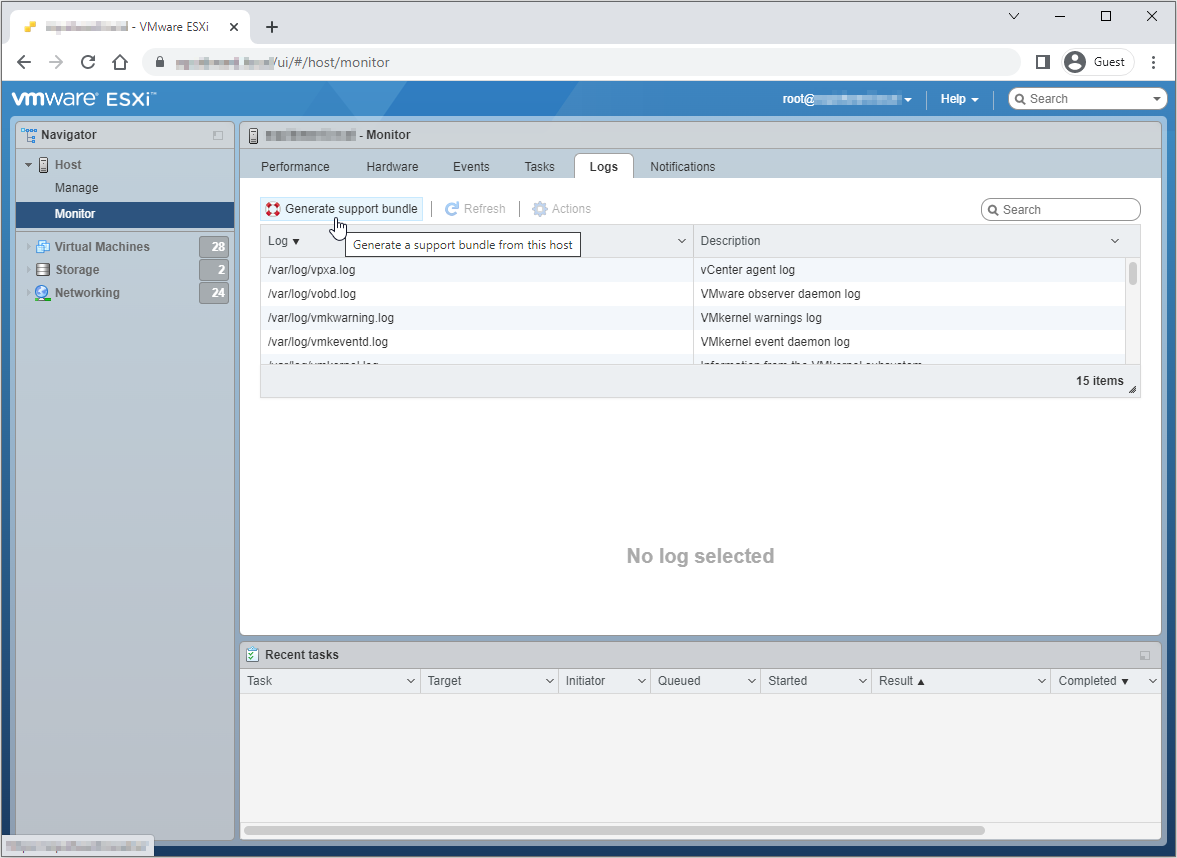
Obtaining a log bundle is simple enough, log in to your problematic ESXi host, select Monitor > Logs > Generate Support Bundle:
Using Skyline Health Diagnostics
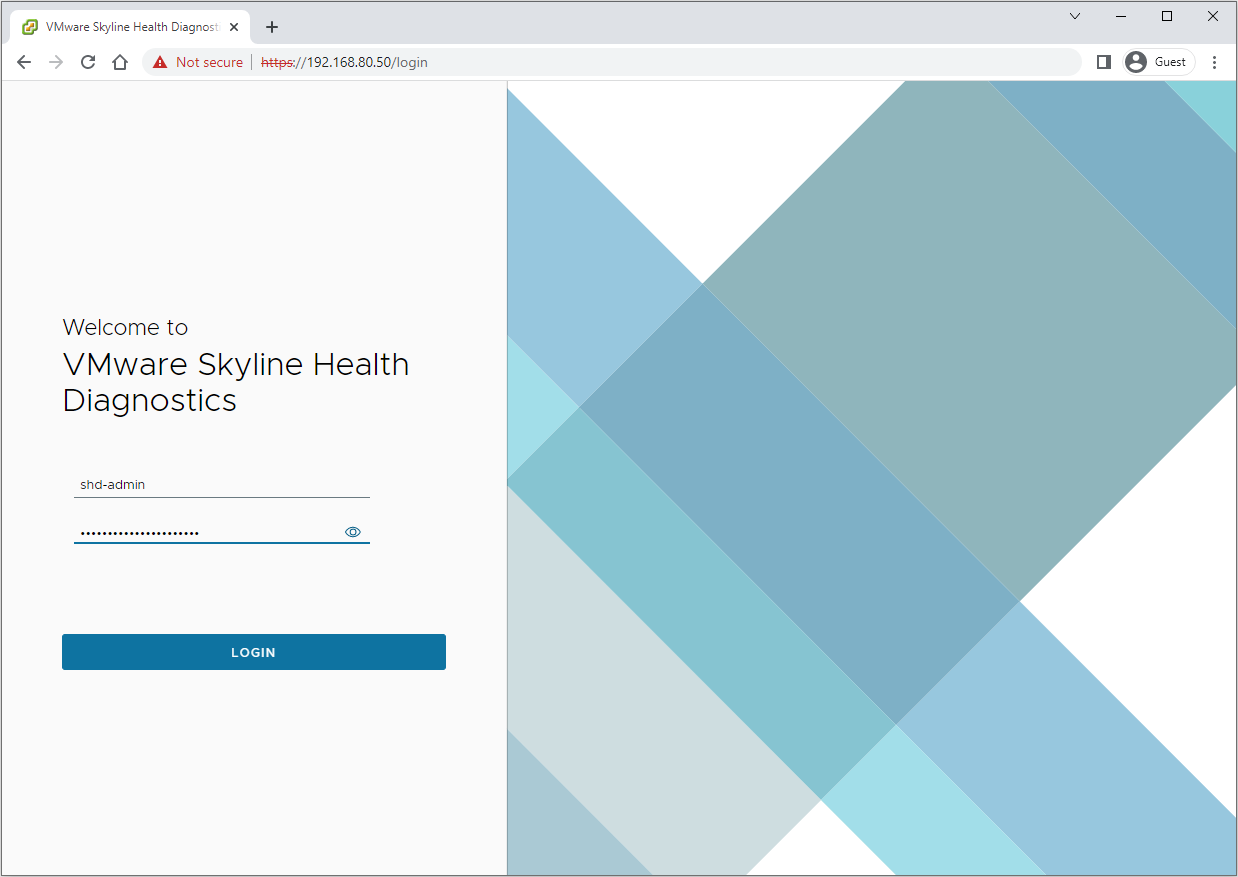
Log into SHD using a web browser, the shd-admin account and the password set during OVA deployment:
Again, as I’m offline here, lets select the Upload Bundles option:
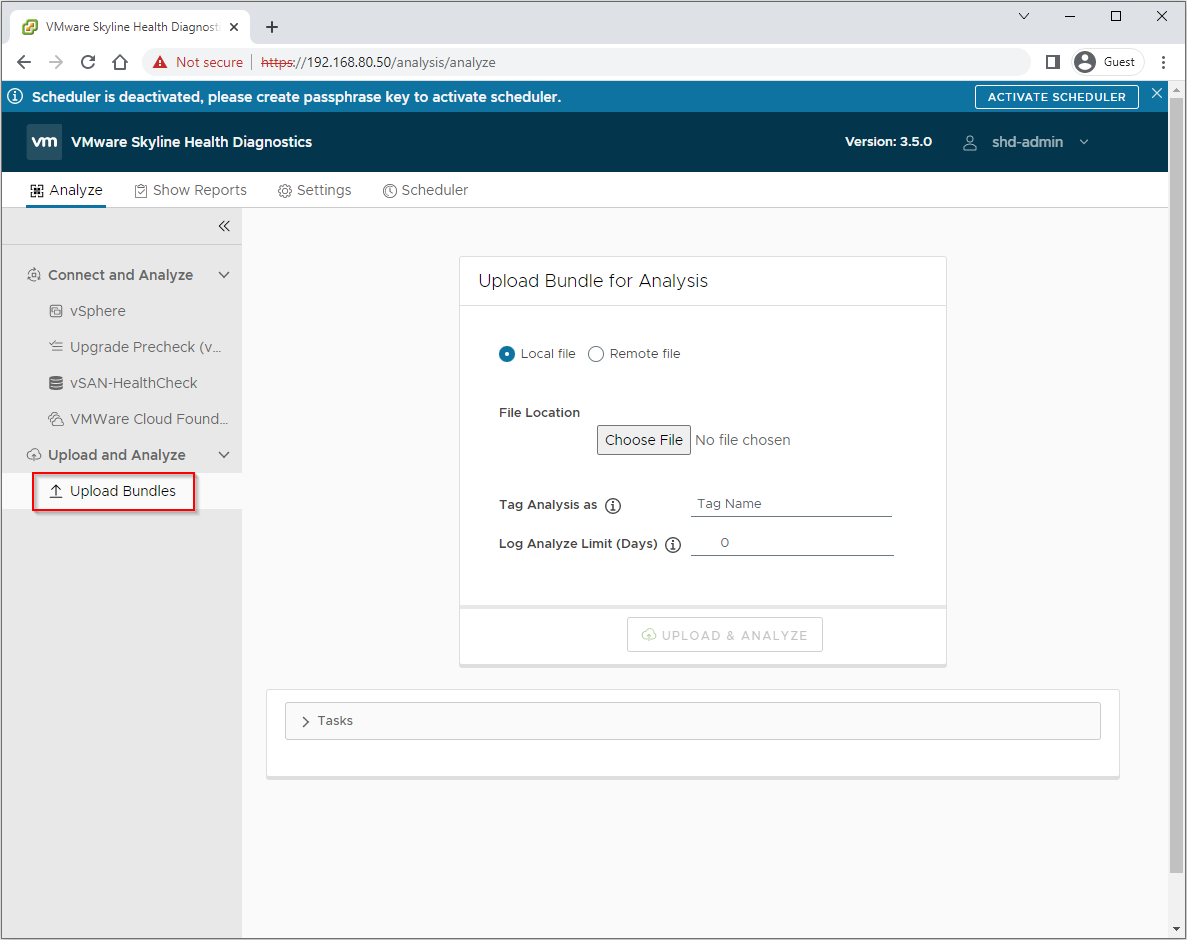
Optionally choose whether to tag the analysis and click Upload + Analyze
Allow the tool to do the analysis, and once complete click Show Report:
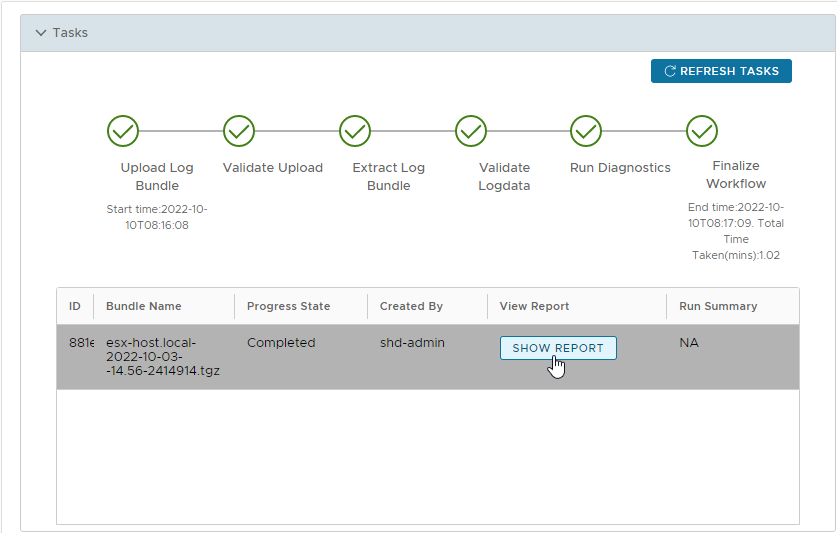
Let’s take a look at the results:

Diagnostic Results
Obviously I can’t show you the diagnostic results of my client systems (data privacy etc), however I can show you the results of a scan of an ESXi server I have running else where:
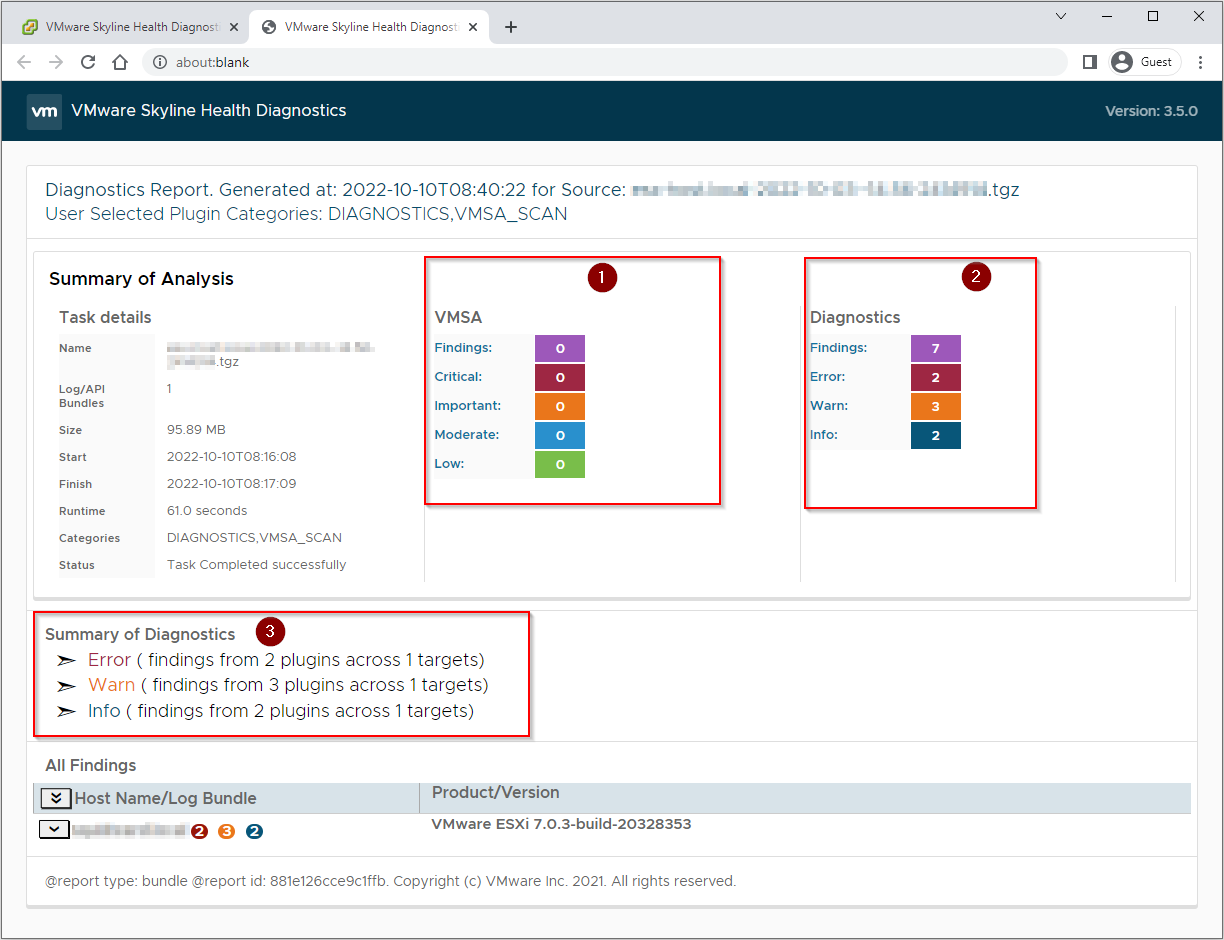
Breaking the results down:
- No VMware Security Advisories (VMSA) findings. Nice, no security patching required

- Seven diagnostic findings!

- Two errors, three warnings and two info items to dig into
… and I thought I kept this environment up to snuff …!
Lets dig into the findings:

Scrolling to the bottom of the page allows you to dig into the findings yet further.
For example, one of my Error findings was that I had NIC connectivity problems on the 9th and 20th of September:
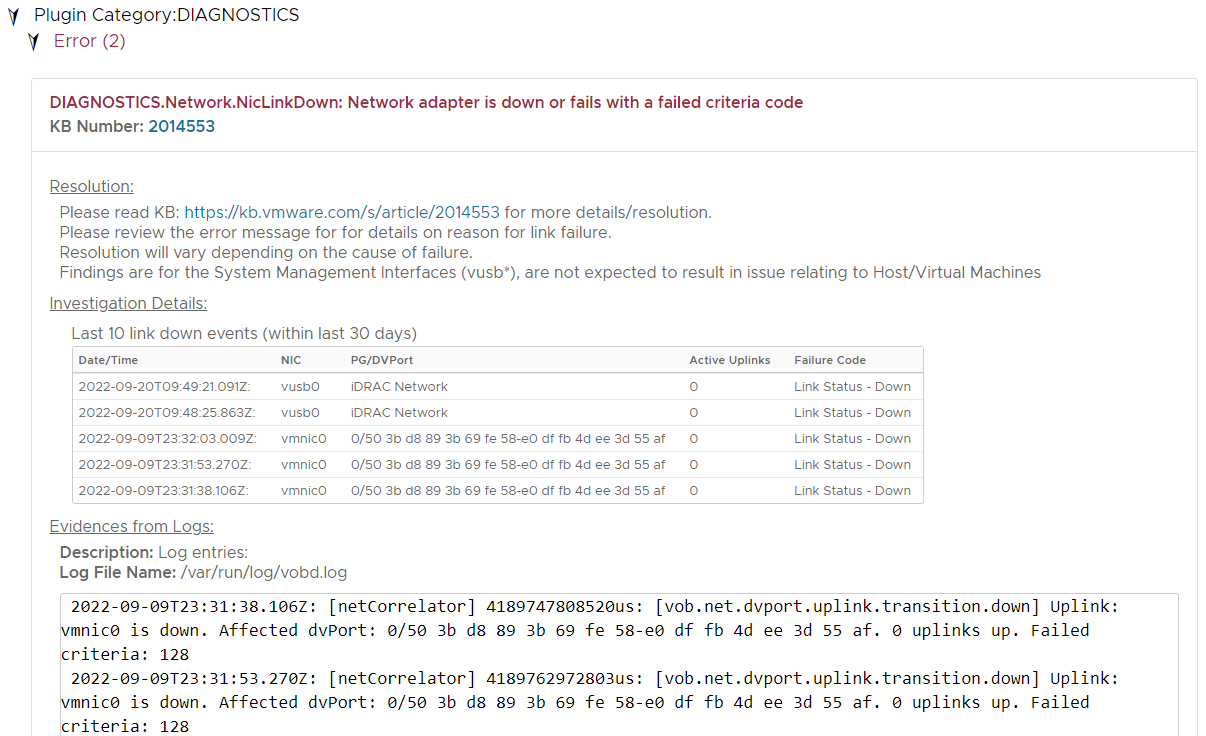
One of the warning findings on my host was that there is a later driver available for my I350 network cards according to the VMware Compatibility Guide (VCG):
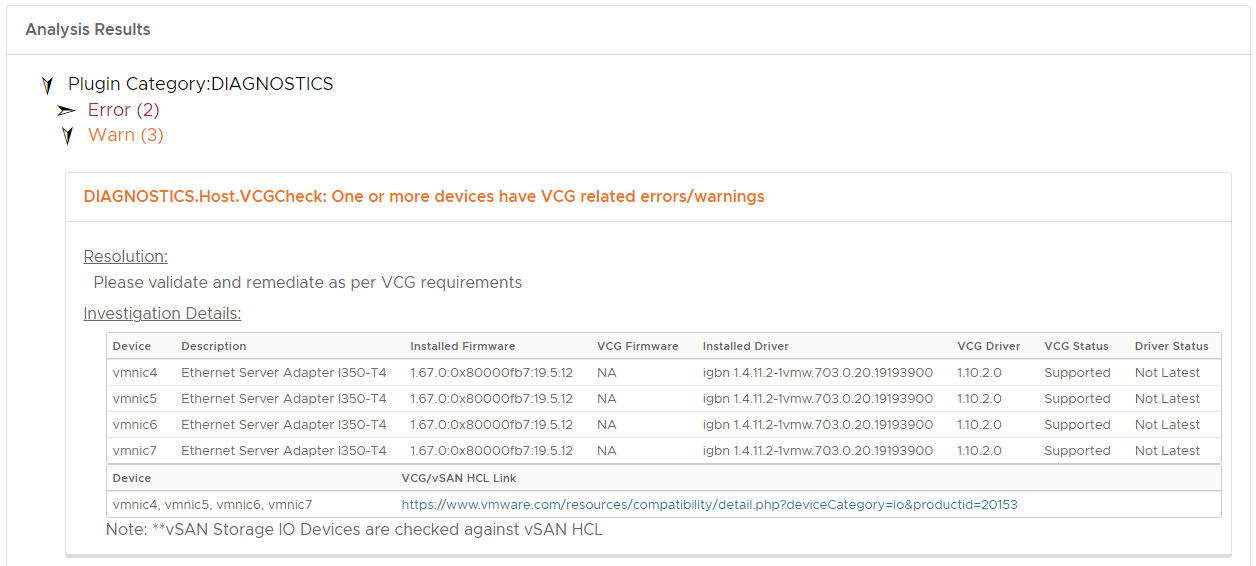
Finally, interestingly the other warning finding was regarding Long VMFS3 rsv time:
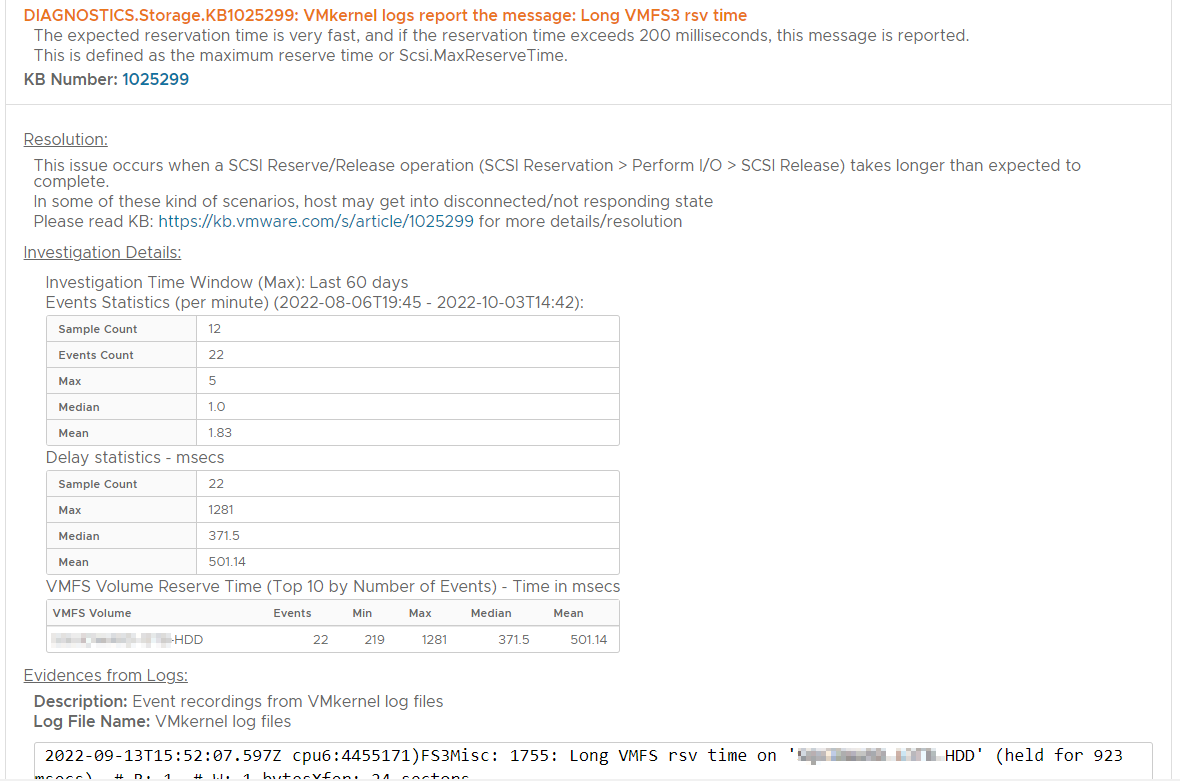
As you can see from the resolution box in the above screenshot, there is a link to KB 1025299.
Yep, I need to take a look at this. I may have a failing HDD I need to take care of…
Conclusion and Wrap Up
So there we have it, a simple VMware log analysis tool that can be used to shed light on your environment. Even environments that were previously thought to be running OK!
Pairing SHD with VMware Workstation means that someone like myself can “parachute” onto a client site, download log bundles from problematic systems, analyse the bundles using the mobile offline SHD instance on a laptop and in next to no time have direction on issues and areas for further investigation plus remediation.
What’s more, with it’s built in VGC database, the SHD tool can also be used to qualify ESXi builds, showing where driver updates and improvements can be made.
Bonus!
-Chris

